
 Yahoo Sport


Could The Market Be Wrong About Steel Dynamics, Inc. (NASDAQ:STLD) Given Its Attractive Financial Prospects?
It is hard to get excited after looking at Steel Dynamics' (NASDAQ:STLD) recent performance, when its stock has declined 11% over the past month. However, a closer look at its sound financials might cause you to think again. Given that fundamentals usually drive long-term market outcomes, the company is worth looking at. Specifically, we decided to study Steel Dynamics' ROE in this article.
Return on equity or ROE is an important factor to be considered by a shareholder because it tells them how effectively their capital is being reinvested. In short, ROE shows the profit each dollar generates with respect to its shareholder investments.
See our latest analysis for Steel Dynamics
How To Calculate Return On Equity?
ROE can be calculated by using the formula:
Return on Equity = Net Profit (from continuing operations) ÷ Shareholders' Equity
So, based on the above formula, the ROE for Steel Dynamics is:
29% = US$1.5b ÷ US$5.0b (Based on the trailing twelve months to June 2021).
The 'return' is the income the business earned over the last year. One way to conceptualize this is that for each $1 of shareholders' capital it has, the company made $0.29 in profit.
What Is The Relationship Between ROE And Earnings Growth?
So far, we've learned that ROE is a measure of a company's profitability. Depending on how much of these profits the company reinvests or "retains", and how effectively it does so, we are then able to assess a company’s earnings growth potential. Generally speaking, other things being equal, firms with a high return on equity and profit retention, have a higher growth rate than firms that don’t share these attributes.
A Side By Side comparison of Steel Dynamics' Earnings Growth And 29% ROE
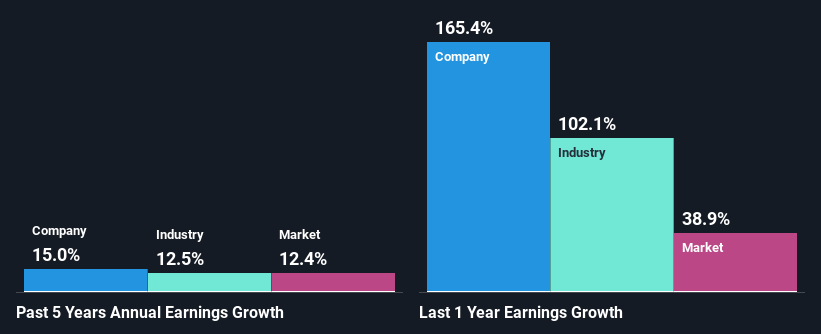
First thing first, we like that Steel Dynamics has an impressive ROE. Second, a comparison with the average ROE reported by the industry of 16% also doesn't go unnoticed by us. This probably laid the groundwork for Steel Dynamics' moderate 15% net income growth seen over the past five years.
As a next step, we compared Steel Dynamics' net income growth with the industry and found that the company has a similar growth figure when compared with the industry average growth rate of 12% in the same period.
Earnings growth is a huge factor in stock valuation. What investors need to determine next is if the expected earnings growth, or the lack of it, is already built into the share price. By doing so, they will have an idea if the stock is headed into clear blue waters or if swampy waters await. Is STLD fairly valued? This infographic on the company's intrinsic value has everything you need to know.
Is Steel Dynamics Making Efficient Use Of Its Profits?
Steel Dynamics' three-year median payout ratio to shareholders is 25% (implying that it retains 75% of its income), which is on the lower side, so it seems like the management is reinvesting profits heavily to grow its business.
Besides, Steel Dynamics has been paying dividends for at least ten years or more. This shows that the company is committed to sharing profits with its shareholders. Upon studying the latest analysts' consensus data, we found that the company is expected to keep paying out approximately 21% of its profits over the next three years. Still, forecasts suggest that Steel Dynamics' future ROE will drop to 20% even though the the company's payout ratio is not expected to change by much.
Conclusion
Overall, we are quite pleased with Steel Dynamics' performance. Particularly, we like that the company is reinvesting heavily into its business, and at a high rate of return. Unsurprisingly, this has led to an impressive earnings growth. With that said, on studying the latest analyst forecasts, we found that while the company has seen growth in its past earnings, analysts expect its future earnings to shrink. To know more about the latest analysts predictions for the company, check out this visualization of analyst forecasts for the company.
This article by Simply Wall St is general in nature. We provide commentary based on historical data and analyst forecasts only using an unbiased methodology and our articles are not intended to be financial advice. It does not constitute a recommendation to buy or sell any stock, and does not take account of your objectives, or your financial situation. We aim to bring you long-term focused analysis driven by fundamental data. Note that our analysis may not factor in the latest price-sensitive company announcements or qualitative material. Simply Wall St has no position in any stocks mentioned.
Have feedback on this article? Concerned about the content? Get in touch with us directly. Alternatively, email editorial-team (at) simplywallst.com.
