
 Yahoo Sport


Expected averages and smart selections - how cricket's data revolution could decide the Ashes
The ongoing data revolution in cricket has changed the game forever. Teams now have all the statistics and analysis they need to come up with smarter on-field plans - and Telegraph Sport looks at how data could play a crucial role in the upcoming Ashes series.
Players improving themselves
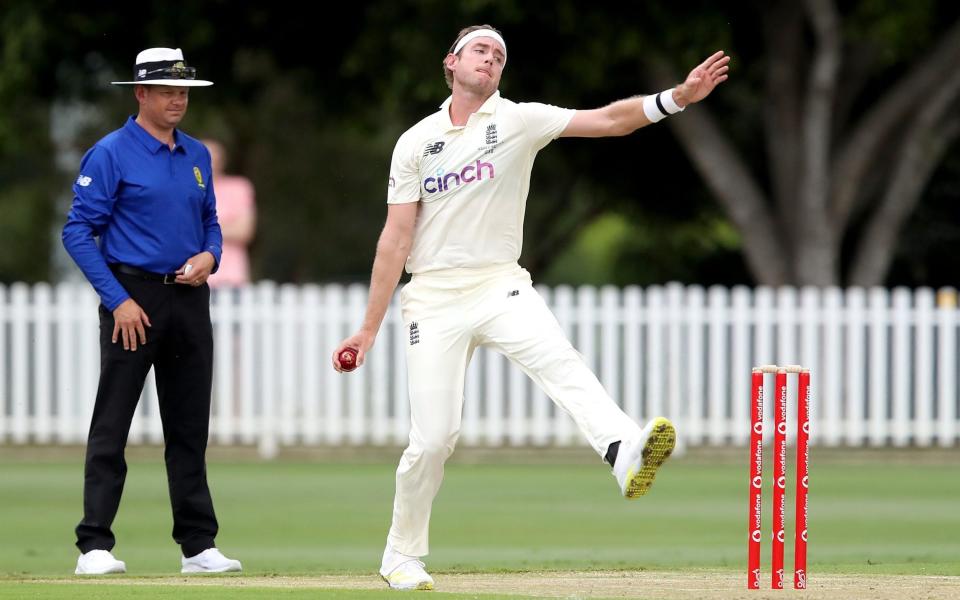
Before the 2019 Ashes series, Stuart Broad was short of his best form. And so he turned to a very modern tool in Test cricket: the analyst.
Nottinghamshire’s analyst, Kunal Manek, showed that, when Broad was at his best, batsmen left under 15 per cent of deliveries. But the figure had almost doubled in some County Championship games in 2019.
The findings led Broad to focus on making the batsmen play more. “I judge myself now on how much I make a batsman play in a day,” Broad explained in 2020. “If I am bowling badly, my leave percentage will be 30 per cent - I am getting left 30 per cent of the time. If I am bowling brilliantly, it will be 16 per cent or 17 per cent.” In 2016, 29 per cent of Broad’s deliveries in the first 30 overs were left alone; this year, that has fallen to 22 per cent.
It was a window into how data is changing Test cricket. For all the focus on data in T20 - and the truth that its impact is more conspicuous in the shortest international format, where the game is easier to map - data will also have a profound impact on the Ashes series.
The use of data in team meetings tends to be made as simple and accessible as possible - and is seldom prescriptive. But for the curious modern player, data offers a tool for them to self-analyse their games and, just as Broad did, identify specific areas to improve.
“I’ve got massive admiration for the way that the modern players break things down and use a lot of information about certain bowlers,” says Mark Butcher, who played 71 Tests for England from 1997-2004. “That wasn't really something that I did, and it would have been handy to have done so, particularly playing away from home.”
Before the tours to Sri Lanka and India last winter, Joe Root analysed his game against spin. He found that the simplest way to improve was to reduce the number of deliveries he faced in the ‘danger zone’ - neither decisively forward to hit the ball before it spins, nor well enough back to react to the turn. In England’s first three Tests of the year, Root avoided the ‘danger zone’ and unfurled scores of 228, 186 and 218.
Selecting smarter
During his international career from 1994-2003, John Crawley averaged 74 against spin, the second highest figure of any Englishman with 20 Test caps. England played 14 Tests in Asia from 2000 until 2003, yet Crawley did not play a single one. But he played nine in Australia, where he performed modestly.
The tools used in selection today means that a player with Crawley’s attributes would be used more wisely now. “I would certainly have loved a subcontinent tour,” Crawley reflects. “Then, selection was very much based on how current incumbents were doing and how you were doing in domestic cricket at the time so there was very little strategic thinking.”
Dawid Malan embodies how thinking on selection has evolved. When Malan was dropped in 2018, Ed Smith, then the national selector, said that “it may be that his game is better suited to overseas conditions”.
It was an insensitive comment to make publicly, yet a window into England’s thinking. Malan’s recall last summer, and selection at No 3 for this Ashes tour, was informed by his fine Ashes tour four years ago and his average of 44.8 against short balls in Test cricket.

Judging performance, not results
In August last year, many were proclaiming that the Test career of England’s highest ever wicket-taker should be at an end. Jimmy Anderson had taken just six wickets at 41.2 apiece in the first three Tests of the English summer. Was he simply too old?
For England there was a simple riposte to this idea. England use expected average - cricket’s version of expected goals - to analyse a player’s underlying performance numbers, which they believe provide a better indication of how a player is really performing over a short period of time.
By these metrics, Anderson had scarcely declined at all. His expected average in the first three Tests of the 2020 summer was 24.8, 16 less than his real average. In 12 Tests since, Anderson has averaged 21.7. Smart use of data helped England see that what looked like bad form was merely bad luck.
In India in February, England used data in the opposite way. Dom Bess took 12 wickets at 21.3 in Sri Lanka, but he could scarcely have been luckier had he found a winning lottery ticket stuck to the bottom of his trainers.
Data endorsed the eye test: Bess’s expected average was 35.9 in Sri Lanka. One match into the series against India, he was dropped.
Bowlers wising up
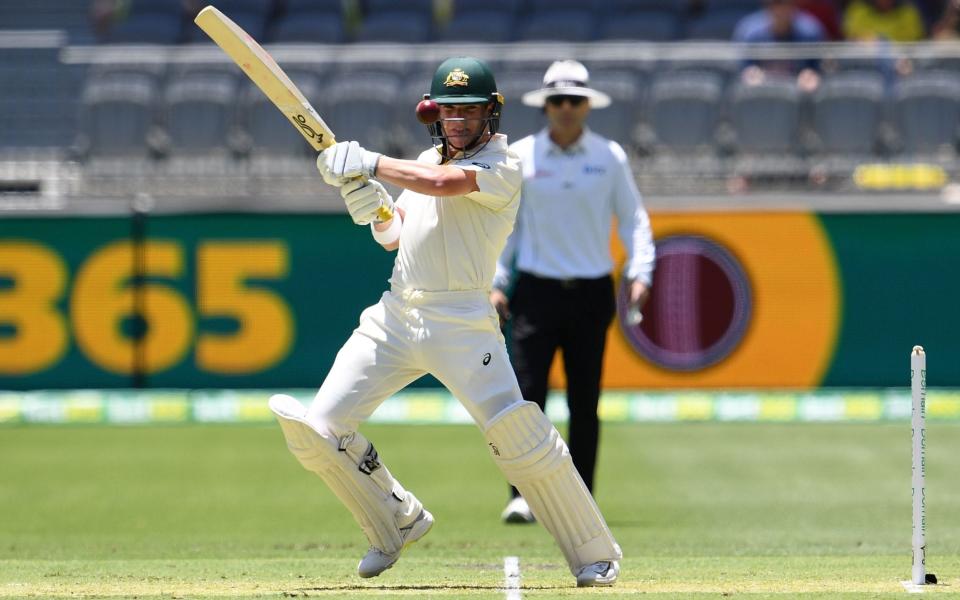
The emasculation of David Warner in the 2019 Ashes was a very human story, of a fine batsman floundering in his first Test series since his ban for the sandpaper affair in front of baying English crowds. But it was also a tale of data impacting Test cricket.
Against Warner in the 2015 Ashes, Broad had only gone around the wicket 41 per cent of the time. Broad’s analysis before the 2019 Ashes suggested that he should go around the wicket more. In 2019, Broad went around the wicket to Warner with every delivery, dismissing him seven times while conceding just 35 runs.
It is a snapshot of a trend that has scythed left-handers down to size. A decade ago, only 21 per cent of deliveries from right-arm quick bowlers to left-handers were from around the wicket; this year, the figure is 54 per cent. Seamers are going round the wicket for a simple reason: it works.
Before 2019, Broad bowled around the wicket only 42 per cent of the time to left-handers, and averaged 35.5 against them in Tests. Since the start of 2019, Broad has gone around the wicket 90 per cent of the time and averaged 20.1 against left-handers.
So at the Gabba, Warner and Marcus Harris, Australia’s southpaw opening pair, will know exactly what to expect. Dealing with it is another matter.
As the sight of Root regularly bowling to left-handers attests, teams are also becoming keener on ensuring that their spinners turn the ball away from the batsman. Most cricketers throughout history have found spin harder when it turns away from their bat, but bowling sides are adopting this policy more than ever before.
From 2000-09, left-handers faced three balls of off spin for every two of leg spin; since 2010, they are facing nearly five balls of off spin for every one of leg spin.
Changing the balance between bat and ball
The rise in data in Test cricket has come during a golden age for bowlers, with Test batting averages plummeting in recent years. This may not be coincidence. By allowing teams to analyse opposing batsmen with microscopic detail, the use of data is helping reveal their weaknesses with greater precision than ever before.
The length of Test matches also provides fertile ground for analysts to observe the game, hatch plans - about, say, the optimal lengths to bowl, or where runs are being scored on the pitch and the best fielding positions to stop them - and then put them to the captain or bowlers during a break, or even by sending a message out onto the field.
When asked which types of cricketers benefit the most from Test cricket’s data revolution, AR Srikkanth, the head analyst at Cricket West Indies, has a simple response. “Bowlers. I feel batting is more on instinct, and bowlers can plan to get a batsman out.” Data could be shifting the equilibrium in Test cricket a little in bowlers’ favour.
