
 Yahoo Sport


Investing in Ramaco Resources (NASDAQ:METC) three years ago would have delivered you a 250% gain
It might seem bad, but the worst that can happen when you buy a stock (without leverage) is that its share price goes to zero. But in contrast you can make much more than 100% if the company does well. For example, the Ramaco Resources, Inc. (NASDAQ:METC) share price has soared 237% in the last three years. That sort of return is as solid as granite. It's also good to see the share price up 12% over the last quarter. The company reported its financial results recently; you can catch up on the latest numbers by reading our company report.
Let's take a look at the underlying fundamentals over the longer term, and see if they've been consistent with shareholders returns.
Check out our latest analysis for Ramaco Resources
In his essay The Superinvestors of Graham-and-Doddsville Warren Buffett described how share prices do not always rationally reflect the value of a business. One imperfect but simple way to consider how the market perception of a company has shifted is to compare the change in the earnings per share (EPS) with the share price movement.
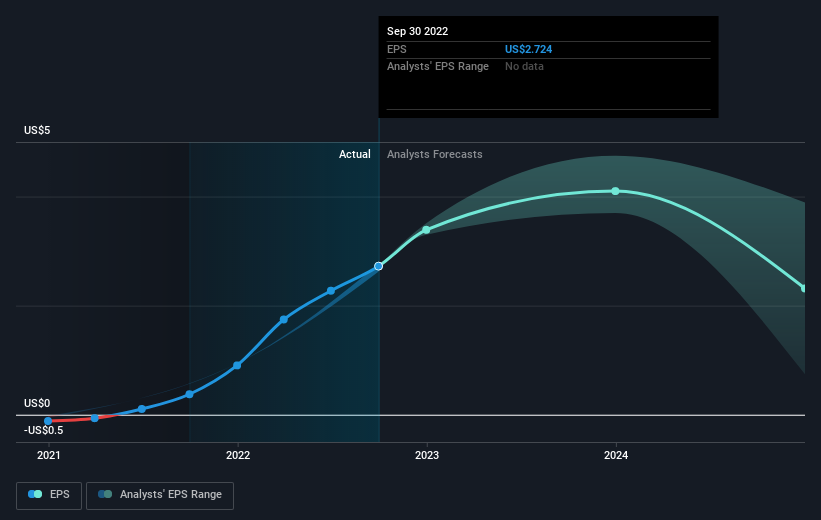
During three years of share price growth, Ramaco Resources achieved compound earnings per share growth of 61% per year. The average annual share price increase of 50% is actually lower than the EPS growth. So one could reasonably conclude that the market has cooled on the stock. We'd venture the lowish P/E ratio of 4.18 also reflects the negative sentiment around the stock.
The graphic below depicts how EPS has changed over time (unveil the exact values by clicking on the image).
It is of course excellent to see how Ramaco Resources has grown profits over the years, but the future is more important for shareholders. You can see how its balance sheet has strengthened (or weakened) over time in this free interactive graphic.
What About Dividends?
When looking at investment returns, it is important to consider the difference between total shareholder return (TSR) and share price return. Whereas the share price return only reflects the change in the share price, the TSR includes the value of dividends (assuming they were reinvested) and the benefit of any discounted capital raising or spin-off. So for companies that pay a generous dividend, the TSR is often a lot higher than the share price return. We note that for Ramaco Resources the TSR over the last 3 years was 250%, which is better than the share price return mentioned above. And there's no prize for guessing that the dividend payments largely explain the divergence!
A Different Perspective
Although it hurts that Ramaco Resources returned a loss of 4.4% in the last twelve months, the broader market was actually worse, returning a loss of 15%. Longer term investors wouldn't be so upset, since they would have made 20%, each year, over five years. It could be that the business is just facing some short term problems, but shareholders should keep a close eye on the fundamentals. I find it very interesting to look at share price over the long term as a proxy for business performance. But to truly gain insight, we need to consider other information, too. Take risks, for example - Ramaco Resources has 3 warning signs (and 2 which can't be ignored) we think you should know about.
If you would prefer to check out another company -- one with potentially superior financials -- then do not miss this free list of companies that have proven they can grow earnings.
Please note, the market returns quoted in this article reflect the market weighted average returns of stocks that currently trade on US exchanges.
Have feedback on this article? Concerned about the content? Get in touch with us directly. Alternatively, email editorial-team (at) simplywallst.com.
This article by Simply Wall St is general in nature. We provide commentary based on historical data and analyst forecasts only using an unbiased methodology and our articles are not intended to be financial advice. It does not constitute a recommendation to buy or sell any stock, and does not take account of your objectives, or your financial situation. We aim to bring you long-term focused analysis driven by fundamental data. Note that our analysis may not factor in the latest price-sensitive company announcements or qualitative material. Simply Wall St has no position in any stocks mentioned.
Join A Paid User Research Session
You’ll receive a US$30 Amazon Gift card for 1 hour of your time while helping us build better investing tools for the individual investors like yourself. Sign up here
