
 Yahoo Sport


TWC Enterprises Limited's (TSE:TWC) Stock Has Shown Weakness Lately But Financial Prospects Look Decent: Is The Market Wrong?
TWC Enterprises (TSE:TWC) has had a rough three months with its share price down 35%. However, the company's fundamentals look pretty decent, and long-term financials are usually aligned with future market price movements. In this article, we decided to focus on TWC Enterprises' ROE.
ROE or return on equity is a useful tool to assess how effectively a company can generate returns on the investment it received from its shareholders. In other words, it is a profitability ratio which measures the rate of return on the capital provided by the company's shareholders.
View our latest analysis for TWC Enterprises
How To Calculate Return On Equity?
The formula for return on equity is:
Return on Equity = Net Profit (from continuing operations) ÷ Shareholders' Equity
So, based on the above formula, the ROE for TWC Enterprises is:
8.5% = CA$36m ÷ CA$418m (Based on the trailing twelve months to June 2021).
The 'return' is the income the business earned over the last year. One way to conceptualize this is that for each CA$1 of shareholders' capital it has, the company made CA$0.09 in profit.
What Is The Relationship Between ROE And Earnings Growth?
Thus far, we have learned that ROE measures how efficiently a company is generating its profits. We now need to evaluate how much profit the company reinvests or "retains" for future growth which then gives us an idea about the growth potential of the company. Assuming all else is equal, companies that have both a higher return on equity and higher profit retention are usually the ones that have a higher growth rate when compared to companies that don't have the same features.
TWC Enterprises' Earnings Growth And 8.5% ROE
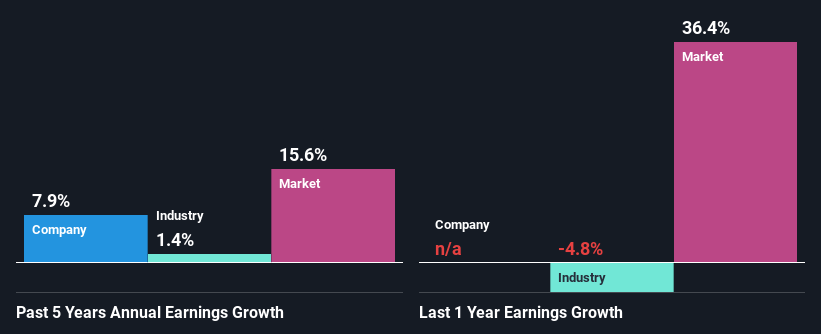
At first glance, TWC Enterprises' ROE doesn't look very promising. Next, when compared to the average industry ROE of 13%, the company's ROE leaves us feeling even less enthusiastic. However, the moderate 7.9% net income growth seen by TWC Enterprises over the past five years is definitely a positive. We reckon that there could be other factors at play here. Such as - high earnings retention or an efficient management in place.
As a next step, we compared TWC Enterprises' net income growth with the industry, and pleasingly, we found that the growth seen by the company is higher than the average industry growth of 1.4%.
The basis for attaching value to a company is, to a great extent, tied to its earnings growth. What investors need to determine next is if the expected earnings growth, or the lack of it, is already built into the share price. By doing so, they will have an idea if the stock is headed into clear blue waters or if swampy waters await. One good indicator of expected earnings growth is the P/E ratio which determines the price the market is willing to pay for a stock based on its earnings prospects. So, you may want to check if TWC Enterprises is trading on a high P/E or a low P/E, relative to its industry.
Is TWC Enterprises Efficiently Re-investing Its Profits?
TWC Enterprises' three-year median payout ratio to shareholders is 6.0% (implying that it retains 94% of its income), which is on the lower side, so it seems like the management is reinvesting profits heavily to grow its business.
Moreover, TWC Enterprises is determined to keep sharing its profits with shareholders which we infer from its long history of paying a dividend for at least ten years.
Conclusion
In total, it does look like TWC Enterprises has some positive aspects to its business. With a high rate of reinvestment, albeit at a low ROE, the company has managed to see a considerable growth in its earnings. While we won't completely dismiss the company, what we would do, is try to ascertain how risky the business is to make a more informed decision around the company. You can see the 2 risks we have identified for TWC Enterprises by visiting our risks dashboard for free on our platform here.
This article by Simply Wall St is general in nature. We provide commentary based on historical data and analyst forecasts only using an unbiased methodology and our articles are not intended to be financial advice. It does not constitute a recommendation to buy or sell any stock, and does not take account of your objectives, or your financial situation. We aim to bring you long-term focused analysis driven by fundamental data. Note that our analysis may not factor in the latest price-sensitive company announcements or qualitative material. Simply Wall St has no position in any stocks mentioned.
Have feedback on this article? Concerned about the content? Get in touch with us directly. Alternatively, email editorial-team (at) simplywallst.com.
