
 Yahoo Sport


Bitcoin (BTC) Sinks to sub-$29,000 as Risk Aversion Spreads
Key Insights:
On Wednesday, bitcoin (BTC) slid by 5.75% to sub-$29,000 as investors reacted to Fed Chair Powell’s comments from Tuesday in a delayed fashion.
The downside came despite the Bitcoin Fear & Greed Index recovering from 8/100, the lowest level since a March 14, 2020 low of 8/100.
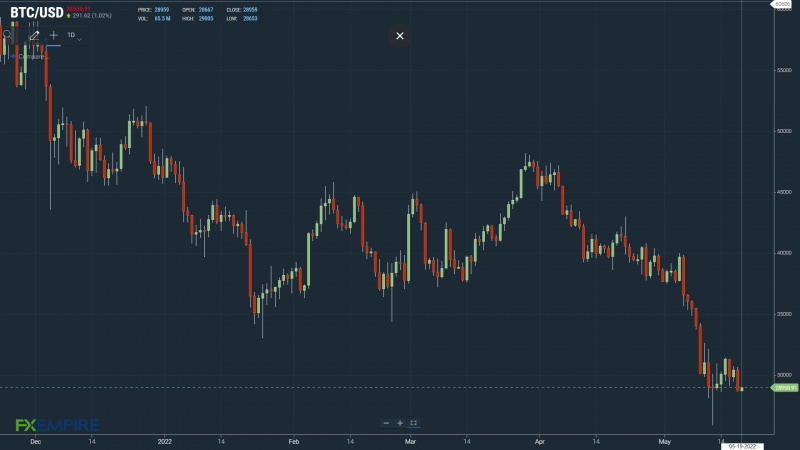
Bitcoin (BTC) technical indicators flash red, with bitcoin sitting below the 50-day EMA.
Bitcoin (BTC) slid by 5.75% on Wednesday, weighed by Fed Chair Powell commentary. Reversing a 1.93% gain from Tuesday, bitcoin ended the day at $28,667.
A mixed session saw bitcoin rise to an early high of $30,674 before hitting reverse.
Falling short of Tuesday’s high of $30,744, bitcoin slid to a late intraday low of $28,610 before steadying.
Bearish sentiment from the US equity markets spilled over to the crypto market, with the bitcoin-NASDAQ correlation strengthening.
The sell-off stemmed from a delayed market reaction to Fed Chair Powell’s speech on Tuesday.
Several drivers are currently in play to test crypto investor appetite. These include the threat of a shift in the regulatory landscape, the fear of a recession, Fed monetary policy, and the risk of another stablecoin collapse.
The Bitcoin Fear & Greed Index Remains Deep in the Extreme Fear Zone
This morning, the Fear & Greed Index rose from 12/100 to 13/100. While continuing to recover from Tuesday’s 8/100, the Index remained deep in the “Extreme Fear” zone, reflecting the bearish sentiment across the crypto market.

The Fear & Greed Index move northward had a muted impact on investor sentiment, with the US equity markets hitting reverse mid-week. The NASDAQ 100 led the way, sliding by 4.73% as investors responded to Fed Chair Powell’s comments from Tuesday.
After providing the markets with assurances about larger rate hikes in the week prior, the Fed Chair talked of a willingness to move policy beyond neutral to curb inflation. Powell also discussed some possible pain ahead for the labor market, while acknowledging that the Fed should have lifted rates sooner.

Bitcoin (BTC) Price Action
At the time of writing, BTC was up 1.02% to $28,959.
Technical Indicators
BTC will need to move through the $29,315 pivot to target the First Major Resistance Level at $30,026 and Wednesday’s high of $30,674.
BTC would need the broader crypto market to support a return to $30,000.
An extended rally would test the Second Major Resistance Level at $31,383 and resistance at $32,000. The Third Major Resistance Level sits at $33,445.
Failure to move through the pivot would test the First Major Support Level at $27,959. Barring another extended sell-off, BTC should steer clear of sub-$27,000 levels. The Second Major Support Level at $27,252 should limit the downside.

Looking at the EMAs and the 4-hourly candlestick chart (below), it is a bearish signal. BTC sits below the 50-day EMA, currently at $30,541. This morning, the 50-day pulled back from the 100-day EMA. The 100-day EMA fell back from the 200-day EMA; BTC negative.
A move through the 50-day EMA would support a run at $32,500.

This article was originally posted on FX Empire
More From FXEMPIRE:
Generali posts smaller-than-expected net profit drop after Russia impairments
Money for Ukraine to top G7 agenda; inflation, food a concern
Deutsche Bank enters new era as chairman’s rocky decade ends
Aussie jumps, safe-haven dollar and yen ease amid Shanghai reopening signs
EasyJet says bookings strong as it posts 545 million stg first half loss
