
 Yahoo Sport


Are Encore Wire Corporation (NASDAQ:WIRE) Investors Paying Above The Intrinsic Value?
Key Insights
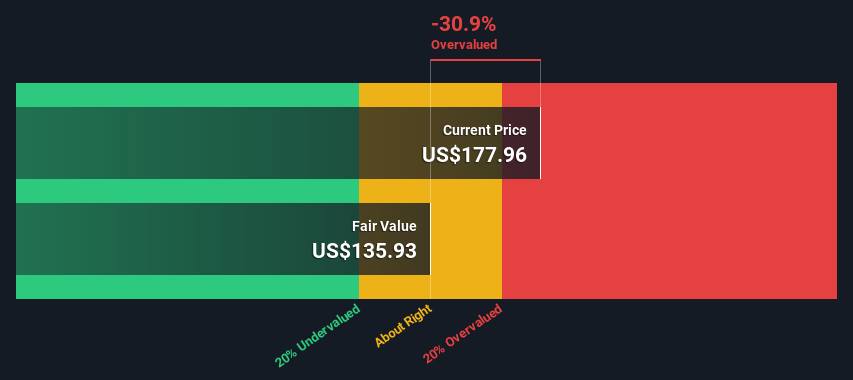
Using the 2 Stage Free Cash Flow to Equity, Encore Wire fair value estimate is US$136
Encore Wire's US$178 share price signals that it might be 31% overvalued
Today we'll do a simple run through of a valuation method used to estimate the attractiveness of Encore Wire Corporation (NASDAQ:WIRE) as an investment opportunity by projecting its future cash flows and then discounting them to today's value. We will use the Discounted Cash Flow (DCF) model on this occasion. Believe it or not, it's not too difficult to follow, as you'll see from our example!
Remember though, that there are many ways to estimate a company's value, and a DCF is just one method. If you still have some burning questions about this type of valuation, take a look at the Simply Wall St analysis model.
View our latest analysis for Encore Wire
The Method
We're using the 2-stage growth model, which simply means we take in account two stages of company's growth. In the initial period the company may have a higher growth rate and the second stage is usually assumed to have a stable growth rate. In the first stage we need to estimate the cash flows to the business over the next ten years. Where possible we use analyst estimates, but when these aren't available we extrapolate the previous free cash flow (FCF) from the last estimate or reported value. We assume companies with shrinking free cash flow will slow their rate of shrinkage, and that companies with growing free cash flow will see their growth rate slow, over this period. We do this to reflect that growth tends to slow more in the early years than it does in later years.
Generally we assume that a dollar today is more valuable than a dollar in the future, so we discount the value of these future cash flows to their estimated value in today's dollars:
10-year free cash flow (FCF) estimate
2023 | 2024 | 2025 | 2026 | 2027 | 2028 | 2029 | 2030 | 2031 | 2032 | |
Levered FCF ($, Millions) | US$256.8m | US$219.9m | US$199.4m | US$187.7m | US$181.1m | US$177.8m | US$176.6m | US$176.9m | US$178.1m | US$180.2m |
Growth Rate Estimate Source | Analyst x2 | Analyst x2 | Est @ -9.32% | Est @ -5.90% | Est @ -3.51% | Est @ -1.84% | Est @ -0.66% | Est @ 0.16% | Est @ 0.73% | Est @ 1.13% |
Present Value ($, Millions) Discounted @ 8.7% | US$236 | US$186 | US$155 | US$134 | US$119 | US$108 | US$98.3 | US$90.5 | US$83.8 | US$78.0 |
("Est" = FCF growth rate estimated by Simply Wall St)
Present Value of 10-year Cash Flow (PVCF) = US$1.3b
After calculating the present value of future cash flows in the initial 10-year period, we need to calculate the Terminal Value, which accounts for all future cash flows beyond the first stage. The Gordon Growth formula is used to calculate Terminal Value at a future annual growth rate equal to the 5-year average of the 10-year government bond yield of 2.1%. We discount the terminal cash flows to today's value at a cost of equity of 8.7%.
Terminal Value (TV)= FCF2032 × (1 + g) ÷ (r – g) = US$180m× (1 + 2.1%) ÷ (8.7%– 2.1%) = US$2.8b
Present Value of Terminal Value (PVTV)= TV / (1 + r)10= US$2.8b÷ ( 1 + 8.7%)10= US$1.2b
The total value is the sum of cash flows for the next ten years plus the discounted terminal value, which results in the Total Equity Value, which in this case is US$2.5b. The last step is to then divide the equity value by the number of shares outstanding. Compared to the current share price of US$178, the company appears reasonably expensive at the time of writing. Valuations are imprecise instruments though, rather like a telescope - move a few degrees and end up in a different galaxy. Do keep this in mind.
The Assumptions
We would point out that the most important inputs to a discounted cash flow are the discount rate and of course the actual cash flows. You don't have to agree with these inputs, I recommend redoing the calculations yourself and playing with them. The DCF also does not consider the possible cyclicality of an industry, or a company's future capital requirements, so it does not give a full picture of a company's potential performance. Given that we are looking at Encore Wire as potential shareholders, the cost of equity is used as the discount rate, rather than the cost of capital (or weighted average cost of capital, WACC) which accounts for debt. In this calculation we've used 8.7%, which is based on a levered beta of 1.122. Beta is a measure of a stock's volatility, compared to the market as a whole. We get our beta from the industry average beta of globally comparable companies, with an imposed limit between 0.8 and 2.0, which is a reasonable range for a stable business.
SWOT Analysis for Encore Wire
Strength
Earnings growth over the past year exceeded the industry.
Currently debt free.
Weakness
Earnings growth over the past year is below its 5-year average.
Dividend is low compared to the top 25% of dividend payers in the Electrical market.
Opportunity
Good value based on P/E ratio compared to estimated Fair P/E ratio.
Threat
No apparent threats visible for WIRE.
Next Steps:
Although the valuation of a company is important, it shouldn't be the only metric you look at when researching a company. It's not possible to obtain a foolproof valuation with a DCF model. Preferably you'd apply different cases and assumptions and see how they would impact the company's valuation. If a company grows at a different rate, or if its cost of equity or risk free rate changes sharply, the output can look very different. Why is the intrinsic value lower than the current share price? For Encore Wire, there are three relevant items you should assess:
Risks: Case in point, we've spotted 2 warning signs for Encore Wire you should be aware of, and 1 of them is a bit unpleasant.
Management:Have insiders been ramping up their shares to take advantage of the market's sentiment for WIRE's future outlook? Check out our management and board analysis with insights on CEO compensation and governance factors.
Other Solid Businesses: Low debt, high returns on equity and good past performance are fundamental to a strong business. Why not explore our interactive list of stocks with solid business fundamentals to see if there are other companies you may not have considered!
PS. The Simply Wall St app conducts a discounted cash flow valuation for every stock on the NASDAQGS every day. If you want to find the calculation for other stocks just search here.
Have feedback on this article? Concerned about the content? Get in touch with us directly. Alternatively, email editorial-team (at) simplywallst.com.
This article by Simply Wall St is general in nature. We provide commentary based on historical data and analyst forecasts only using an unbiased methodology and our articles are not intended to be financial advice. It does not constitute a recommendation to buy or sell any stock, and does not take account of your objectives, or your financial situation. We aim to bring you long-term focused analysis driven by fundamental data. Note that our analysis may not factor in the latest price-sensitive company announcements or qualitative material. Simply Wall St has no position in any stocks mentioned.
Join A Paid User Research Session
You’ll receive a US$30 Amazon Gift card for 1 hour of your time while helping us build better investing tools for the individual investors like yourself. Sign up here
