
 Yahoo Sport


Is Enphase Energy, Inc. (NASDAQ:ENPH) Expensive For A Reason? A Look At Its Intrinsic Value
Key Insights
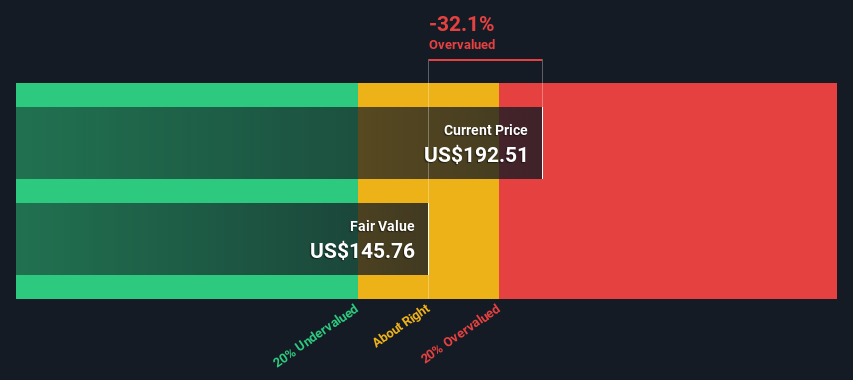
Enphase Energy's estimated fair value is US$146 based on 2 Stage Free Cash Flow to Equity
Enphase Energy's US$193 share price signals that it might be 32% overvalued
The US$292 analyst price target for ENPH is 100% more than our estimate of fair value
Does the March share price for Enphase Energy, Inc. (NASDAQ:ENPH) reflect what it's really worth? Today, we will estimate the stock's intrinsic value by taking the forecast future cash flows of the company and discounting them back to today's value. We will take advantage of the Discounted Cash Flow (DCF) model for this purpose. Don't get put off by the jargon, the math behind it is actually quite straightforward.
We generally believe that a company's value is the present value of all of the cash it will generate in the future. However, a DCF is just one valuation metric among many, and it is not without flaws. If you want to learn more about discounted cash flow, the rationale behind this calculation can be read in detail in the Simply Wall St analysis model.
View our latest analysis for Enphase Energy
The Method
We're using the 2-stage growth model, which simply means we take in account two stages of company's growth. In the initial period the company may have a higher growth rate and the second stage is usually assumed to have a stable growth rate. To start off with, we need to estimate the next ten years of cash flows. Where possible we use analyst estimates, but when these aren't available we extrapolate the previous free cash flow (FCF) from the last estimate or reported value. We assume companies with shrinking free cash flow will slow their rate of shrinkage, and that companies with growing free cash flow will see their growth rate slow, over this period. We do this to reflect that growth tends to slow more in the early years than it does in later years.
Generally we assume that a dollar today is more valuable than a dollar in the future, so we need to discount the sum of these future cash flows to arrive at a present value estimate:
10-year free cash flow (FCF) estimate
2023 | 2024 | 2025 | 2026 | 2027 | 2028 | 2029 | 2030 | 2031 | 2032 | |
Levered FCF ($, Millions) | US$774.9m | US$1.00b | US$1.25b | US$1.43b | US$1.60b | US$1.72b | US$1.82b | US$1.91b | US$1.99b | US$2.05b |
Growth Rate Estimate Source | Analyst x13 | Analyst x13 | Analyst x8 | Analyst x4 | Analyst x4 | Est @ 7.71% | Est @ 6.02% | Est @ 4.83% | Est @ 4.00% | Est @ 3.42% |
Present Value ($, Millions) Discounted @ 9.7% | US$706 | US$833 | US$944 | US$987 | US$1.0k | US$986 | US$953 | US$911 | US$864 | US$814 |
("Est" = FCF growth rate estimated by Simply Wall St)
Present Value of 10-year Cash Flow (PVCF) = US$9.0b
The second stage is also known as Terminal Value, this is the business's cash flow after the first stage. For a number of reasons a very conservative growth rate is used that cannot exceed that of a country's GDP growth. In this case we have used the 5-year average of the 10-year government bond yield (2.1%) to estimate future growth. In the same way as with the 10-year 'growth' period, we discount future cash flows to today's value, using a cost of equity of 9.7%.
Terminal Value (TV)= FCF2032 × (1 + g) ÷ (r – g) = US$2.1b× (1 + 2.1%) ÷ (9.7%– 2.1%) = US$27b
Present Value of Terminal Value (PVTV)= TV / (1 + r)10= US$27b÷ ( 1 + 9.7%)10= US$11b
The total value, or equity value, is then the sum of the present value of the future cash flows, which in this case is US$20b. In the final step we divide the equity value by the number of shares outstanding. Compared to the current share price of US$193, the company appears reasonably expensive at the time of writing. The assumptions in any calculation have a big impact on the valuation, so it is better to view this as a rough estimate, not precise down to the last cent.
The Assumptions
The calculation above is very dependent on two assumptions. The first is the discount rate and the other is the cash flows. You don't have to agree with these inputs, I recommend redoing the calculations yourself and playing with them. The DCF also does not consider the possible cyclicality of an industry, or a company's future capital requirements, so it does not give a full picture of a company's potential performance. Given that we are looking at Enphase Energy as potential shareholders, the cost of equity is used as the discount rate, rather than the cost of capital (or weighted average cost of capital, WACC) which accounts for debt. In this calculation we've used 9.7%, which is based on a levered beta of 1.284. Beta is a measure of a stock's volatility, compared to the market as a whole. We get our beta from the industry average beta of globally comparable companies, with an imposed limit between 0.8 and 2.0, which is a reasonable range for a stable business.
SWOT Analysis for Enphase Energy
Strength
Earnings growth over the past year exceeded the industry.
Debt is not viewed as a risk.
Weakness
Expensive based on P/E ratio and estimated fair value.
Opportunity
Annual earnings are forecast to grow faster than the American market.
Threat
Revenue is forecast to grow slower than 20% per year.
Moving On:
Whilst important, the DCF calculation is only one of many factors that you need to assess for a company. The DCF model is not a perfect stock valuation tool. Instead the best use for a DCF model is to test certain assumptions and theories to see if they would lead to the company being undervalued or overvalued. For instance, if the terminal value growth rate is adjusted slightly, it can dramatically alter the overall result. Why is the intrinsic value lower than the current share price? For Enphase Energy, there are three relevant factors you should further research:
Financial Health: Does ENPH have a healthy balance sheet? Take a look at our free balance sheet analysis with six simple checks on key factors like leverage and risk.
Future Earnings: How does ENPH's growth rate compare to its peers and the wider market? Dig deeper into the analyst consensus number for the upcoming years by interacting with our free analyst growth expectation chart.
Other High Quality Alternatives: Do you like a good all-rounder? Explore our interactive list of high quality stocks to get an idea of what else is out there you may be missing!
PS. The Simply Wall St app conducts a discounted cash flow valuation for every stock on the NASDAQGM every day. If you want to find the calculation for other stocks just search here.
Have feedback on this article? Concerned about the content? Get in touch with us directly. Alternatively, email editorial-team (at) simplywallst.com.
This article by Simply Wall St is general in nature. We provide commentary based on historical data and analyst forecasts only using an unbiased methodology and our articles are not intended to be financial advice. It does not constitute a recommendation to buy or sell any stock, and does not take account of your objectives, or your financial situation. We aim to bring you long-term focused analysis driven by fundamental data. Note that our analysis may not factor in the latest price-sensitive company announcements or qualitative material. Simply Wall St has no position in any stocks mentioned.
Join A Paid User Research Session
You’ll receive a US$30 Amazon Gift card for 1 hour of your time while helping us build better investing tools for the individual investors like yourself. Sign up here
