
 Yahoo Sport


Investors in SP Plus (NASDAQ:SP) have unfortunately lost 23% over the last five years
Ideally, your overall portfolio should beat the market average. But every investor is virtually certain to have both over-performing and under-performing stocks. At this point some shareholders may be questioning their investment in SP Plus Corporation (NASDAQ:SP), since the last five years saw the share price fall 23%. Unfortunately the share price momentum is still quite negative, with prices down 8.9% in thirty days. But this could be related to poor market conditions -- stocks are down 11% in the same time.
Now let's have a look at the company's fundamentals, and see if the long term shareholder return has matched the performance of the underlying business.
View our latest analysis for SP Plus
While markets are a powerful pricing mechanism, share prices reflect investor sentiment, not just underlying business performance. One way to examine how market sentiment has changed over time is to look at the interaction between a company's share price and its earnings per share (EPS).
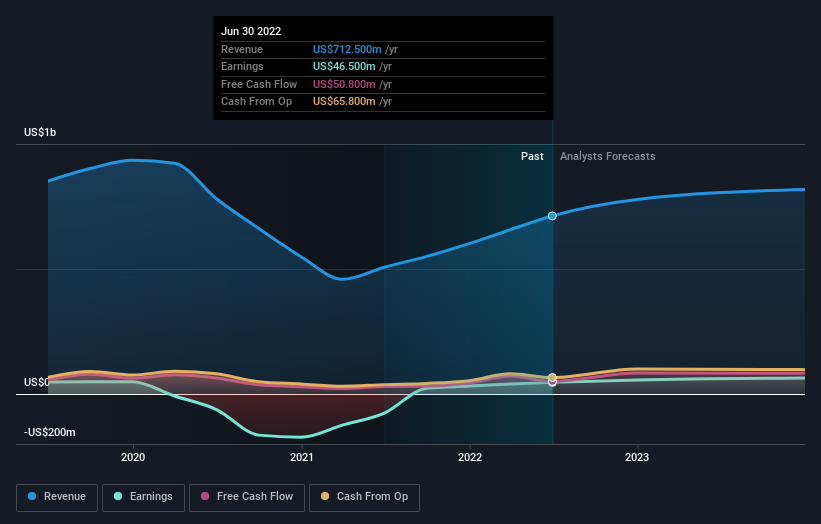
SP Plus became profitable within the last five years. That would generally be considered a positive, so we are surprised to see the share price is down. Other metrics might give us a better handle on how its value is changing over time.
Arguably, the revenue drop of 9.7% a year for half a decade suggests that the company can't grow in the long term. This has probably encouraged some shareholders to sell down the stock.
The image below shows how earnings and revenue have tracked over time (if you click on the image you can see greater detail).
We know that SP Plus has improved its bottom line lately, but what does the future have in store? So it makes a lot of sense to check out what analysts think SP Plus will earn in the future (free profit forecasts).
A Different Perspective
While it's never nice to take a loss, SP Plus shareholders can take comfort that their trailing twelve month loss of 2.5% wasn't as bad as the market loss of around 21%. Of far more concern is the 4% p.a. loss served to shareholders over the last five years. While the losses are slowing we doubt many shareholders are happy with the stock. I find it very interesting to look at share price over the long term as a proxy for business performance. But to truly gain insight, we need to consider other information, too. For example, we've discovered 2 warning signs for SP Plus that you should be aware of before investing here.
If you would prefer to check out another company -- one with potentially superior financials -- then do not miss this free list of companies that have proven they can grow earnings.
Please note, the market returns quoted in this article reflect the market weighted average returns of stocks that currently trade on US exchanges.
Have feedback on this article? Concerned about the content? Get in touch with us directly. Alternatively, email editorial-team (at) simplywallst.com.
This article by Simply Wall St is general in nature. We provide commentary based on historical data and analyst forecasts only using an unbiased methodology and our articles are not intended to be financial advice. It does not constitute a recommendation to buy or sell any stock, and does not take account of your objectives, or your financial situation. We aim to bring you long-term focused analysis driven by fundamental data. Note that our analysis may not factor in the latest price-sensitive company announcements or qualitative material. Simply Wall St has no position in any stocks mentioned.
Join A Paid User Research Session
You’ll receive a US$30 Amazon Gift card for 1 hour of your time while helping us build better investing tools for the individual investors like yourself. Sign up here
