
 Yahoo Sport


A Look At The Fair Value Of Hipages Group Holdings Limited (ASX:HPG)
Key Insights
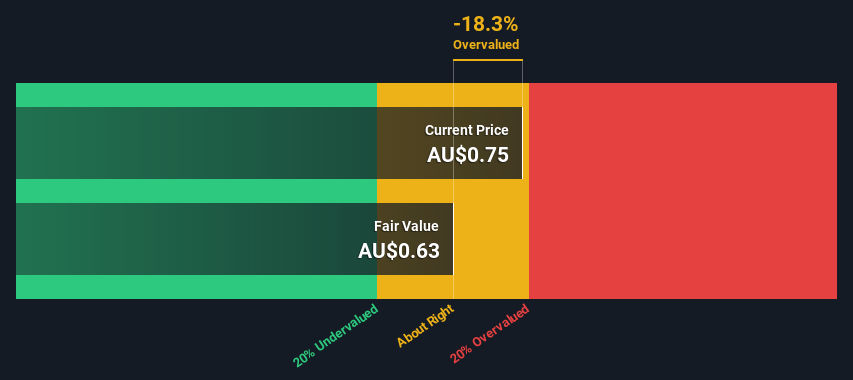
Using the 2 Stage Free Cash Flow to Equity, Hipages Group Holdings fair value estimate is AU$0.63
Current share price of AU$0.75 suggests Hipages Group Holdings is potentially trading close to its fair value
The AU$1.48 analyst price target for HPG is 133% more than our estimate of fair value
In this article we are going to estimate the intrinsic value of Hipages Group Holdings Limited (ASX:HPG) by taking the forecast future cash flows of the company and discounting them back to today's value. One way to achieve this is by employing the Discounted Cash Flow (DCF) model. Believe it or not, it's not too difficult to follow, as you'll see from our example!
We generally believe that a company's value is the present value of all of the cash it will generate in the future. However, a DCF is just one valuation metric among many, and it is not without flaws. Anyone interested in learning a bit more about intrinsic value should have a read of the Simply Wall St analysis model.
See our latest analysis for Hipages Group Holdings
The Model
We are going to use a two-stage DCF model, which, as the name states, takes into account two stages of growth. The first stage is generally a higher growth period which levels off heading towards the terminal value, captured in the second 'steady growth' period. In the first stage we need to estimate the cash flows to the business over the next ten years. Where possible we use analyst estimates, but when these aren't available we extrapolate the previous free cash flow (FCF) from the last estimate or reported value. We assume companies with shrinking free cash flow will slow their rate of shrinkage, and that companies with growing free cash flow will see their growth rate slow, over this period. We do this to reflect that growth tends to slow more in the early years than it does in later years.
Generally we assume that a dollar today is more valuable than a dollar in the future, and so the sum of these future cash flows is then discounted to today's value:
10-year free cash flow (FCF) estimate
2023 | 2024 | 2025 | 2026 | 2027 | 2028 | 2029 | 2030 | 2031 | 2032 | |
Levered FCF (A$, Millions) | AU$13.0m | AU$15.0m | AU$17.0m | AU$6.00m | AU$5.10m | AU$4.60m | AU$4.31m | AU$4.14m | AU$4.05m | AU$4.02m |
Growth Rate Estimate Source | Analyst x1 | Analyst x1 | Analyst x1 | Analyst x1 | Analyst x1 | Est @ -9.86% | Est @ -6.32% | Est @ -3.83% | Est @ -2.09% | Est @ -0.88% |
Present Value (A$, Millions) Discounted @ 8.7% | AU$12.0 | AU$12.7 | AU$13.2 | AU$4.3 | AU$3.4 | AU$2.8 | AU$2.4 | AU$2.1 | AU$1.9 | AU$1.7 |
("Est" = FCF growth rate estimated by Simply Wall St)
Present Value of 10-year Cash Flow (PVCF) = AU$57m
The second stage is also known as Terminal Value, this is the business's cash flow after the first stage. For a number of reasons a very conservative growth rate is used that cannot exceed that of a country's GDP growth. In this case we have used the 5-year average of the 10-year government bond yield (2.0%) to estimate future growth. In the same way as with the 10-year 'growth' period, we discount future cash flows to today's value, using a cost of equity of 8.7%.
Terminal Value (TV)= FCF2032 × (1 + g) ÷ (r – g) = AU$4.0m× (1 + 2.0%) ÷ (8.7%– 2.0%) = AU$61m
Present Value of Terminal Value (PVTV)= TV / (1 + r)10= AU$61m÷ ( 1 + 8.7%)10= AU$27m
The total value is the sum of cash flows for the next ten years plus the discounted terminal value, which results in the Total Equity Value, which in this case is AU$83m. In the final step we divide the equity value by the number of shares outstanding. Compared to the current share price of AU$0.8, the company appears around fair value at the time of writing. The assumptions in any calculation have a big impact on the valuation, so it is better to view this as a rough estimate, not precise down to the last cent.
Important Assumptions
Now the most important inputs to a discounted cash flow are the discount rate, and of course, the actual cash flows. If you don't agree with these result, have a go at the calculation yourself and play with the assumptions. The DCF also does not consider the possible cyclicality of an industry, or a company's future capital requirements, so it does not give a full picture of a company's potential performance. Given that we are looking at Hipages Group Holdings as potential shareholders, the cost of equity is used as the discount rate, rather than the cost of capital (or weighted average cost of capital, WACC) which accounts for debt. In this calculation we've used 8.7%, which is based on a levered beta of 1.130. Beta is a measure of a stock's volatility, compared to the market as a whole. We get our beta from the industry average beta of globally comparable companies, with an imposed limit between 0.8 and 2.0, which is a reasonable range for a stable business.
Moving On:
Although the valuation of a company is important, it is only one of many factors that you need to assess for a company. It's not possible to obtain a foolproof valuation with a DCF model. Rather it should be seen as a guide to "what assumptions need to be true for this stock to be under/overvalued?" If a company grows at a different rate, or if its cost of equity or risk free rate changes sharply, the output can look very different. For Hipages Group Holdings, we've put together three additional items you should explore:
Risks: Every company has them, and we've spotted 1 warning sign for Hipages Group Holdings you should know about.
Future Earnings: How does HPG's growth rate compare to its peers and the wider market? Dig deeper into the analyst consensus number for the upcoming years by interacting with our free analyst growth expectation chart.
Other Solid Businesses: Low debt, high returns on equity and good past performance are fundamental to a strong business. Why not explore our interactive list of stocks with solid business fundamentals to see if there are other companies you may not have considered!
PS. Simply Wall St updates its DCF calculation for every Australian stock every day, so if you want to find the intrinsic value of any other stock just search here.
Have feedback on this article? Concerned about the content? Get in touch with us directly. Alternatively, email editorial-team (at) simplywallst.com.
This article by Simply Wall St is general in nature. We provide commentary based on historical data and analyst forecasts only using an unbiased methodology and our articles are not intended to be financial advice. It does not constitute a recommendation to buy or sell any stock, and does not take account of your objectives, or your financial situation. We aim to bring you long-term focused analysis driven by fundamental data. Note that our analysis may not factor in the latest price-sensitive company announcements or qualitative material. Simply Wall St has no position in any stocks mentioned.
Join A Paid User Research Session
You’ll receive a US$30 Amazon Gift card for 1 hour of your time while helping us build better investing tools for the individual investors like yourself. Sign up here
