
 Yahoo Sport


A Look At The Intrinsic Value Of Quartix Technologies plc (LON:QTX)
Key Insights
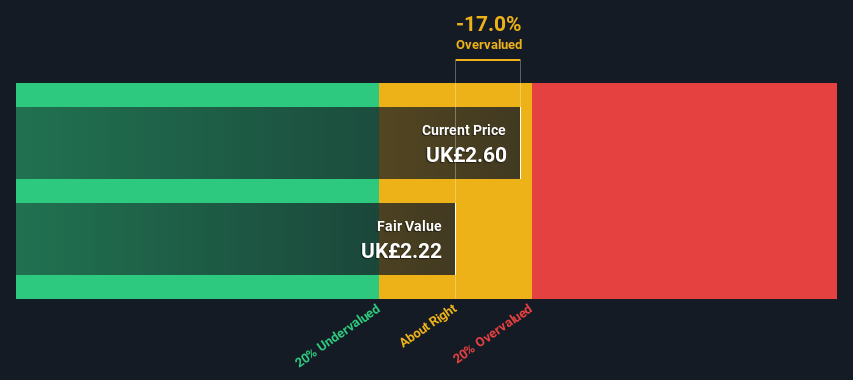
The projected fair value for Quartix Technologies is UK£2.22 based on 2 Stage Free Cash Flow to Equity
With UK£2.60 share price, Quartix Technologies appears to be trading close to its estimated fair value
Industry average of 24% suggests Quartix Technologies' peers are currently trading at a higher premium to fair value
Today we will run through one way of estimating the intrinsic value of Quartix Technologies plc (LON:QTX) by taking the forecast future cash flows of the company and discounting them back to today's value. We will use the Discounted Cash Flow (DCF) model on this occasion. Before you think you won't be able to understand it, just read on! It's actually much less complex than you'd imagine.
Companies can be valued in a lot of ways, so we would point out that a DCF is not perfect for every situation. If you want to learn more about discounted cash flow, the rationale behind this calculation can be read in detail in the Simply Wall St analysis model.
Check out our latest analysis for Quartix Technologies
The Method
We use what is known as a 2-stage model, which simply means we have two different periods of growth rates for the company's cash flows. Generally the first stage is higher growth, and the second stage is a lower growth phase. To begin with, we have to get estimates of the next ten years of cash flows. Where possible we use analyst estimates, but when these aren't available we extrapolate the previous free cash flow (FCF) from the last estimate or reported value. We assume companies with shrinking free cash flow will slow their rate of shrinkage, and that companies with growing free cash flow will see their growth rate slow, over this period. We do this to reflect that growth tends to slow more in the early years than it does in later years.
A DCF is all about the idea that a dollar in the future is less valuable than a dollar today, and so the sum of these future cash flows is then discounted to today's value:
10-year free cash flow (FCF) estimate
2023 | 2024 | 2025 | 2026 | 2027 | 2028 | 2029 | 2030 | 2031 | 2032 | |
Levered FCF (£, Millions) | UK£4.30m | UK£5.70m | UK£6.45m | UK£7.07m | UK£7.57m | UK£7.97m | UK£8.30m | UK£8.56m | UK£8.78m | UK£8.97m |
Growth Rate Estimate Source | Analyst x1 | Analyst x1 | Est @ 13.22% | Est @ 9.60% | Est @ 7.06% | Est @ 5.29% | Est @ 4.05% | Est @ 3.18% | Est @ 2.57% | Est @ 2.14% |
Present Value (£, Millions) Discounted @ 8.1% | UK£4.0 | UK£4.9 | UK£5.1 | UK£5.2 | UK£5.1 | UK£5.0 | UK£4.8 | UK£4.6 | UK£4.4 | UK£4.1 |
("Est" = FCF growth rate estimated by Simply Wall St)
Present Value of 10-year Cash Flow (PVCF) = UK£47m
We now need to calculate the Terminal Value, which accounts for all the future cash flows after this ten year period. The Gordon Growth formula is used to calculate Terminal Value at a future annual growth rate equal to the 5-year average of the 10-year government bond yield of 1.2%. We discount the terminal cash flows to today's value at a cost of equity of 8.1%.
Terminal Value (TV)= FCF2032 × (1 + g) ÷ (r – g) = UK£9.0m× (1 + 1.2%) ÷ (8.1%– 1.2%) = UK£131m
Present Value of Terminal Value (PVTV)= TV / (1 + r)10= UK£131m÷ ( 1 + 8.1%)10= UK£60m
The total value, or equity value, is then the sum of the present value of the future cash flows, which in this case is UK£108m. To get the intrinsic value per share, we divide this by the total number of shares outstanding. Compared to the current share price of UK£2.6, the company appears around fair value at the time of writing. Valuations are imprecise instruments though, rather like a telescope - move a few degrees and end up in a different galaxy. Do keep this in mind.
The Assumptions
The calculation above is very dependent on two assumptions. The first is the discount rate and the other is the cash flows. You don't have to agree with these inputs, I recommend redoing the calculations yourself and playing with them. The DCF also does not consider the possible cyclicality of an industry, or a company's future capital requirements, so it does not give a full picture of a company's potential performance. Given that we are looking at Quartix Technologies as potential shareholders, the cost of equity is used as the discount rate, rather than the cost of capital (or weighted average cost of capital, WACC) which accounts for debt. In this calculation we've used 8.1%, which is based on a levered beta of 0.993. Beta is a measure of a stock's volatility, compared to the market as a whole. We get our beta from the industry average beta of globally comparable companies, with an imposed limit between 0.8 and 2.0, which is a reasonable range for a stable business.
SWOT Analysis for Quartix Technologies
Strength
Earnings growth over the past year exceeded its 5-year average.
Currently debt free.
Weakness
Earnings growth over the past year underperformed the Software industry.
Dividend is low compared to the top 25% of dividend payers in the Software market.
Shareholders have been diluted in the past year.
Opportunity
Annual earnings are forecast to grow faster than the British market.
Good value based on P/E ratio compared to estimated Fair P/E ratio.
Threat
Dividends are not covered by cash flow.
Moving On:
Whilst important, the DCF calculation is only one of many factors that you need to assess for a company. The DCF model is not a perfect stock valuation tool. Rather it should be seen as a guide to "what assumptions need to be true for this stock to be under/overvalued?" If a company grows at a different rate, or if its cost of equity or risk free rate changes sharply, the output can look very different. For Quartix Technologies, we've put together three additional elements you should further examine:
Risks: Consider for instance, the ever-present spectre of investment risk. We've identified 2 warning signs with Quartix Technologies , and understanding these should be part of your investment process.
Management:Have insiders been ramping up their shares to take advantage of the market's sentiment for QTX's future outlook? Check out our management and board analysis with insights on CEO compensation and governance factors.
Other High Quality Alternatives: Do you like a good all-rounder? Explore our interactive list of high quality stocks to get an idea of what else is out there you may be missing!
PS. The Simply Wall St app conducts a discounted cash flow valuation for every stock on the AIM every day. If you want to find the calculation for other stocks just search here.
Have feedback on this article? Concerned about the content? Get in touch with us directly. Alternatively, email editorial-team (at) simplywallst.com.
This article by Simply Wall St is general in nature. We provide commentary based on historical data and analyst forecasts only using an unbiased methodology and our articles are not intended to be financial advice. It does not constitute a recommendation to buy or sell any stock, and does not take account of your objectives, or your financial situation. We aim to bring you long-term focused analysis driven by fundamental data. Note that our analysis may not factor in the latest price-sensitive company announcements or qualitative material. Simply Wall St has no position in any stocks mentioned.
Join A Paid User Research Session
You’ll receive a US$30 Amazon Gift card for 1 hour of your time while helping us build better investing tools for the individual investors like yourself. Sign up here
