
 Yahoo Sport


Positive week for MYR Group Inc. (NASDAQ:MYRG) institutional investors who lost 17% over the past year
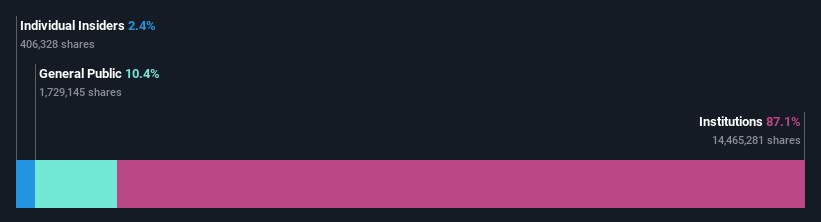
To get a sense of who is truly in control of MYR Group Inc. (NASDAQ:MYRG), it is important to understand the ownership structure of the business. With 87% stake, institutions possess the maximum shares in the company. In other words, the group stands to gain the most (or lose the most) from their investment into the company.
Institutional investors would probably welcome last week's 5.1% increase in share prices after a year of 17% losses as a sign that returns are likely to begin trending higher.
In the chart below, we zoom in on the different ownership groups of MYR Group.
See our latest analysis for MYR Group
What Does The Institutional Ownership Tell Us About MYR Group?
Institutional investors commonly compare their own returns to the returns of a commonly followed index. So they generally do consider buying larger companies that are included in the relevant benchmark index.
MYR Group already has institutions on the share registry. Indeed, they own a respectable stake in the company. This can indicate that the company has a certain degree of credibility in the investment community. However, it is best to be wary of relying on the supposed validation that comes with institutional investors. They too, get it wrong sometimes. It is not uncommon to see a big share price drop if two large institutional investors try to sell out of a stock at the same time. So it is worth checking the past earnings trajectory of MYR Group, (below). Of course, keep in mind that there are other factors to consider, too.

Institutional investors own over 50% of the company, so together than can probably strongly influence board decisions. MYR Group is not owned by hedge funds. The company's largest shareholder is BlackRock, Inc., with ownership of 17%. Meanwhile, the second and third largest shareholders, hold 7.4% and 6.8%, of the shares outstanding, respectively. Furthermore, CEO Richard Swartz is the owner of 0.8% of the company's shares.
We also observed that the top 8 shareholders account for more than half of the share register, with a few smaller shareholders to balance the interests of the larger ones to a certain extent.
While it makes sense to study institutional ownership data for a company, it also makes sense to study analyst sentiments to know which way the wind is blowing. There are a reasonable number of analysts covering the stock, so it might be useful to find out their aggregate view on the future.
Insider Ownership Of MYR Group
The definition of an insider can differ slightly between different countries, but members of the board of directors always count. Company management run the business, but the CEO will answer to the board, even if he or she is a member of it.
Insider ownership is positive when it signals leadership are thinking like the true owners of the company. However, high insider ownership can also give immense power to a small group within the company. This can be negative in some circumstances.
We can see that insiders own shares in MYR Group Inc.. It is a pretty big company, so it is generally a positive to see some potentially meaningful alignment. In this case, they own around US$38m worth of shares (at current prices). Most would say this shows alignment of interests between shareholders and the board. Still, it might be worth checking if those insiders have been selling.
General Public Ownership
The general public-- including retail investors -- own 10% stake in the company, and hence can't easily be ignored. This size of ownership, while considerable, may not be enough to change company policy if the decision is not in sync with other large shareholders.
Next Steps:
It's always worth thinking about the different groups who own shares in a company. But to understand MYR Group better, we need to consider many other factors.
I like to dive deeper into how a company has performed in the past. You can find historic revenue and earnings in this detailed graph.
But ultimately it is the future, not the past, that will determine how well the owners of this business will do. Therefore we think it advisable to take a look at this free report showing whether analysts are predicting a brighter future.
NB: Figures in this article are calculated using data from the last twelve months, which refer to the 12-month period ending on the last date of the month the financial statement is dated. This may not be consistent with full year annual report figures.
Have feedback on this article? Concerned about the content? Get in touch with us directly. Alternatively, email editorial-team (at) simplywallst.com.
This article by Simply Wall St is general in nature. We provide commentary based on historical data and analyst forecasts only using an unbiased methodology and our articles are not intended to be financial advice. It does not constitute a recommendation to buy or sell any stock, and does not take account of your objectives, or your financial situation. We aim to bring you long-term focused analysis driven by fundamental data. Note that our analysis may not factor in the latest price-sensitive company announcements or qualitative material. Simply Wall St has no position in any stocks mentioned.
Join A Paid User Research Session
You’ll receive a US$30 Amazon Gift card for 1 hour of your time while helping us build better investing tools for the individual investors like yourself. Sign up here
