
 Yahoo Sport


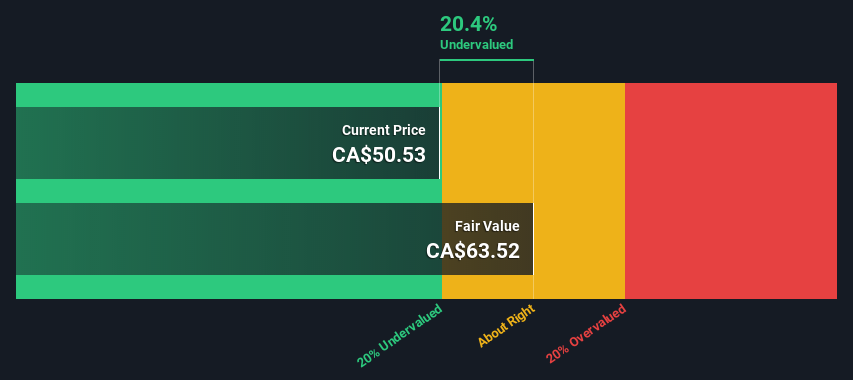
Stella-Jones Inc. (TSE:SJ) Shares Could Be 20% Below Their Intrinsic Value Estimate
Key Insights
Stella-Jones' estimated fair value is CA$63.52 based on 2 Stage Free Cash Flow to Equity
Stella-Jones' CA$50.53 share price signals that it might be 20% undervalued
The CA$62.43 analyst price target for SJ is 1.7% less than our estimate of fair value
How far off is Stella-Jones Inc. (TSE:SJ) from its intrinsic value? Using the most recent financial data, we'll take a look at whether the stock is fairly priced by taking the forecast future cash flows of the company and discounting them back to today's value. The Discounted Cash Flow (DCF) model is the tool we will apply to do this. Don't get put off by the jargon, the math behind it is actually quite straightforward.
Remember though, that there are many ways to estimate a company's value, and a DCF is just one method. For those who are keen learners of equity analysis, the Simply Wall St analysis model here may be something of interest to you.
View our latest analysis for Stella-Jones
Is Stella-Jones Fairly Valued?
We're using the 2-stage growth model, which simply means we take in account two stages of company's growth. In the initial period the company may have a higher growth rate and the second stage is usually assumed to have a stable growth rate. To start off with, we need to estimate the next ten years of cash flows. Where possible we use analyst estimates, but when these aren't available we extrapolate the previous free cash flow (FCF) from the last estimate or reported value. We assume companies with shrinking free cash flow will slow their rate of shrinkage, and that companies with growing free cash flow will see their growth rate slow, over this period. We do this to reflect that growth tends to slow more in the early years than it does in later years.
A DCF is all about the idea that a dollar in the future is less valuable than a dollar today, so we need to discount the sum of these future cash flows to arrive at a present value estimate:
10-year free cash flow (FCF) estimate
2023 | 2024 | 2025 | 2026 | 2027 | 2028 | 2029 | 2030 | 2031 | 2032 | |
Levered FCF (CA$, Millions) | CA$281.2m | CA$256.7m | CA$306.5m | CA$339.9m | CA$367.7m | CA$390.6m | CA$409.8m | CA$426.0m | CA$440.0m | CA$452.5m |
Growth Rate Estimate Source | Analyst x4 | Analyst x4 | Analyst x1 | Est @ 10.91% | Est @ 8.16% | Est @ 6.24% | Est @ 4.90% | Est @ 3.96% | Est @ 3.30% | Est @ 2.84% |
Present Value (CA$, Millions) Discounted @ 11% | CA$253 | CA$208 | CA$223 | CA$223 | CA$217 | CA$207 | CA$195 | CA$183 | CA$170 | CA$157 |
("Est" = FCF growth rate estimated by Simply Wall St)
Present Value of 10-year Cash Flow (PVCF) = CA$2.0b
The second stage is also known as Terminal Value, this is the business's cash flow after the first stage. The Gordon Growth formula is used to calculate Terminal Value at a future annual growth rate equal to the 5-year average of the 10-year government bond yield of 1.8%. We discount the terminal cash flows to today's value at a cost of equity of 11%.
Terminal Value (TV)= FCF2032 × (1 + g) ÷ (r – g) = CA$453m× (1 + 1.8%) ÷ (11%– 1.8%) = CA$4.9b
Present Value of Terminal Value (PVTV)= TV / (1 + r)10= CA$4.9b÷ ( 1 + 11%)10= CA$1.7b
The total value, or equity value, is then the sum of the present value of the future cash flows, which in this case is CA$3.7b. In the final step we divide the equity value by the number of shares outstanding. Compared to the current share price of CA$50.5, the company appears a touch undervalued at a 20% discount to where the stock price trades currently. Remember though, that this is just an approximate valuation, and like any complex formula - garbage in, garbage out.
Important Assumptions
We would point out that the most important inputs to a discounted cash flow are the discount rate and of course the actual cash flows. If you don't agree with these result, have a go at the calculation yourself and play with the assumptions. The DCF also does not consider the possible cyclicality of an industry, or a company's future capital requirements, so it does not give a full picture of a company's potential performance. Given that we are looking at Stella-Jones as potential shareholders, the cost of equity is used as the discount rate, rather than the cost of capital (or weighted average cost of capital, WACC) which accounts for debt. In this calculation we've used 11%, which is based on a levered beta of 1.585. Beta is a measure of a stock's volatility, compared to the market as a whole. We get our beta from the industry average beta of globally comparable companies, with an imposed limit between 0.8 and 2.0, which is a reasonable range for a stable business.
SWOT Analysis for Stella-Jones
Strength
Earnings growth over the past year exceeded the industry.
Debt is well covered by earnings and cashflows.
Dividends are covered by earnings and cash flows.
Weakness
Earnings growth over the past year is below its 5-year average.
Dividend is low compared to the top 25% of dividend payers in the Forestry market.
Opportunity
Annual earnings are forecast to grow for the next 3 years.
Trading below our estimate of fair value by more than 20%.
Threat
Annual earnings are forecast to grow slower than the Canadian market.
Moving On:
Although the valuation of a company is important, it shouldn't be the only metric you look at when researching a company. The DCF model is not a perfect stock valuation tool. Rather it should be seen as a guide to "what assumptions need to be true for this stock to be under/overvalued?" For instance, if the terminal value growth rate is adjusted slightly, it can dramatically alter the overall result. Can we work out why the company is trading at a discount to intrinsic value? For Stella-Jones, there are three pertinent items you should consider:
Risks: We feel that you should assess the 1 warning sign for Stella-Jones we've flagged before making an investment in the company.
Future Earnings: How does SJ's growth rate compare to its peers and the wider market? Dig deeper into the analyst consensus number for the upcoming years by interacting with our free analyst growth expectation chart.
Other High Quality Alternatives: Do you like a good all-rounder? Explore our interactive list of high quality stocks to get an idea of what else is out there you may be missing!
PS. The Simply Wall St app conducts a discounted cash flow valuation for every stock on the TSX every day. If you want to find the calculation for other stocks just search here.
Have feedback on this article? Concerned about the content? Get in touch with us directly. Alternatively, email editorial-team (at) simplywallst.com.
This article by Simply Wall St is general in nature. We provide commentary based on historical data and analyst forecasts only using an unbiased methodology and our articles are not intended to be financial advice. It does not constitute a recommendation to buy or sell any stock, and does not take account of your objectives, or your financial situation. We aim to bring you long-term focused analysis driven by fundamental data. Note that our analysis may not factor in the latest price-sensitive company announcements or qualitative material. Simply Wall St has no position in any stocks mentioned.
Join A Paid User Research Session
You’ll receive a US$30 Amazon Gift card for 1 hour of your time while helping us build better investing tools for the individual investors like yourself. Sign up here
