
 Yahoo Sport


As Truist Financial (NYSE:TFC) ascends 3.6% this past week, investors may now be noticing the company's one-year earnings growth
Investors can earn very close to the average market return by buying an index fund. In contrast individual stocks will provide a wide range of possible returns, and may fall short. One such example is Truist Financial Corporation (NYSE:TFC), which saw its share price fall 27% over a year, against a market decline of 22%. Even if shareholders bought some time ago, they wouldn't be particularly happy: the stock is down 25% in three years. More recently, the share price has dropped a further 9.2% in a month. However, we note the price may have been impacted by the broader market, which is down 4.5% in the same time period.
While the last year has been tough for Truist Financial shareholders, this past week has shown signs of promise. So let's look at the longer term fundamentals and see if they've been the driver of the negative returns.
View our latest analysis for Truist Financial
To quote Buffett, 'Ships will sail around the world but the Flat Earth Society will flourish. There will continue to be wide discrepancies between price and value in the marketplace...' One way to examine how market sentiment has changed over time is to look at the interaction between a company's share price and its earnings per share (EPS).
During the unfortunate twelve months during which the Truist Financial share price fell, it actually saw its earnings per share (EPS) improve by 2.8%. It could be that the share price was previously over-hyped.
By glancing at these numbers, we'd posit that the the market had expectations of much higher growth, last year. But looking to other metrics might better explain the share price change.
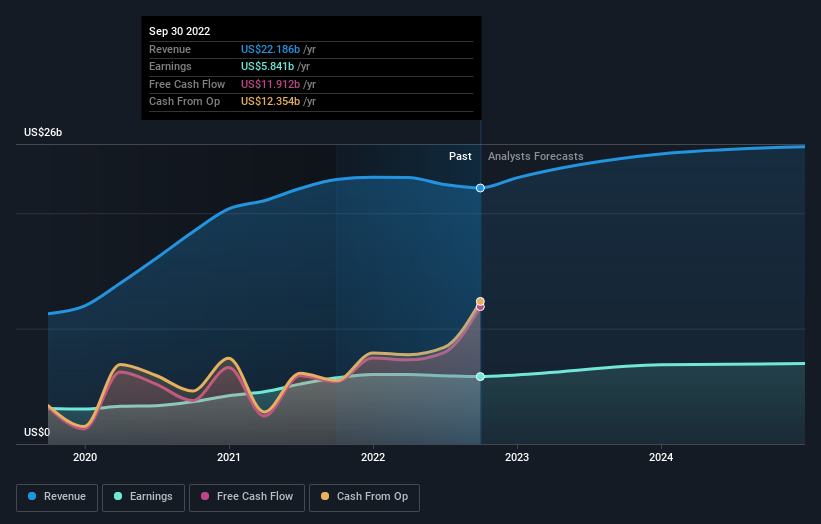
We don't see any weakness in the Truist Financial's dividend so the steady payout can't really explain the share price drop. We'd be more worried about the fact that revenue fell 3.2% year on year. The market may be extrapolating the decline, leading to questions around the sustainability of the EPS.
The company's revenue and earnings (over time) are depicted in the image below (click to see the exact numbers).
We consider it positive that insiders have made significant purchases in the last year. Having said that, most people consider earnings and revenue growth trends to be a more meaningful guide to the business. If you are thinking of buying or selling Truist Financial stock, you should check out this free report showing analyst profit forecasts.
What About Dividends?
When looking at investment returns, it is important to consider the difference between total shareholder return (TSR) and share price return. The TSR is a return calculation that accounts for the value of cash dividends (assuming that any dividend received was reinvested) and the calculated value of any discounted capital raisings and spin-offs. Arguably, the TSR gives a more comprehensive picture of the return generated by a stock. We note that for Truist Financial the TSR over the last 1 year was -24%, which is better than the share price return mentioned above. The dividends paid by the company have thusly boosted the total shareholder return.
A Different Perspective
While the broader market lost about 22% in the twelve months, Truist Financial shareholders did even worse, losing 24% (even including dividends). Having said that, it's inevitable that some stocks will be oversold in a falling market. The key is to keep your eyes on the fundamental developments. Longer term investors wouldn't be so upset, since they would have made 0.5%, each year, over five years. It could be that the recent sell-off is an opportunity, so it may be worth checking the fundamental data for signs of a long term growth trend. If you want to research this stock further, the data on insider buying is an obvious place to start. You can click here to see who has been buying shares - and the price they paid.
If you like to buy stocks alongside management, then you might just love this free list of companies. (Hint: insiders have been buying them).
Please note, the market returns quoted in this article reflect the market weighted average returns of stocks that currently trade on US exchanges.
Have feedback on this article? Concerned about the content? Get in touch with us directly. Alternatively, email editorial-team (at) simplywallst.com.
This article by Simply Wall St is general in nature. We provide commentary based on historical data and analyst forecasts only using an unbiased methodology and our articles are not intended to be financial advice. It does not constitute a recommendation to buy or sell any stock, and does not take account of your objectives, or your financial situation. We aim to bring you long-term focused analysis driven by fundamental data. Note that our analysis may not factor in the latest price-sensitive company announcements or qualitative material. Simply Wall St has no position in any stocks mentioned.
Join A Paid User Research Session
You’ll receive a US$30 Amazon Gift card for 1 hour of your time while helping us build better investing tools for the individual investors like yourself. Sign up here
